Solar
Solar panel payback in the UK: what the numbers actually look like in 2026
Export rates, tariff shifts and cheaper hardware have moved the maths. Here is an honest breakdown of what a typical UK home recovers, and how quickly.
Most payback figures you see online are built on optimistic assumptions: perfect south-facing roofs, no shading, and an owner who happens to be home all day. Real homes are messier. This is how we model it before we quote.
The three numbers that decide your payback
Generation, self-consumption and export value. Generation is fixed by your roof. Self-consumption is behavioural, and it is the single biggest lever you control. Export value depends entirely on the tariff you sign.
- Generation: a 4 kWp south-facing array in southern England typically produces 3,600–4,000 kWh a year.
- Self-consumption: 25–35% without a battery, rising to 65–80% with one.
- Export: current smart export tariffs range widely, and the headline rate is rarely the whole story.
Where the estimates go wrong
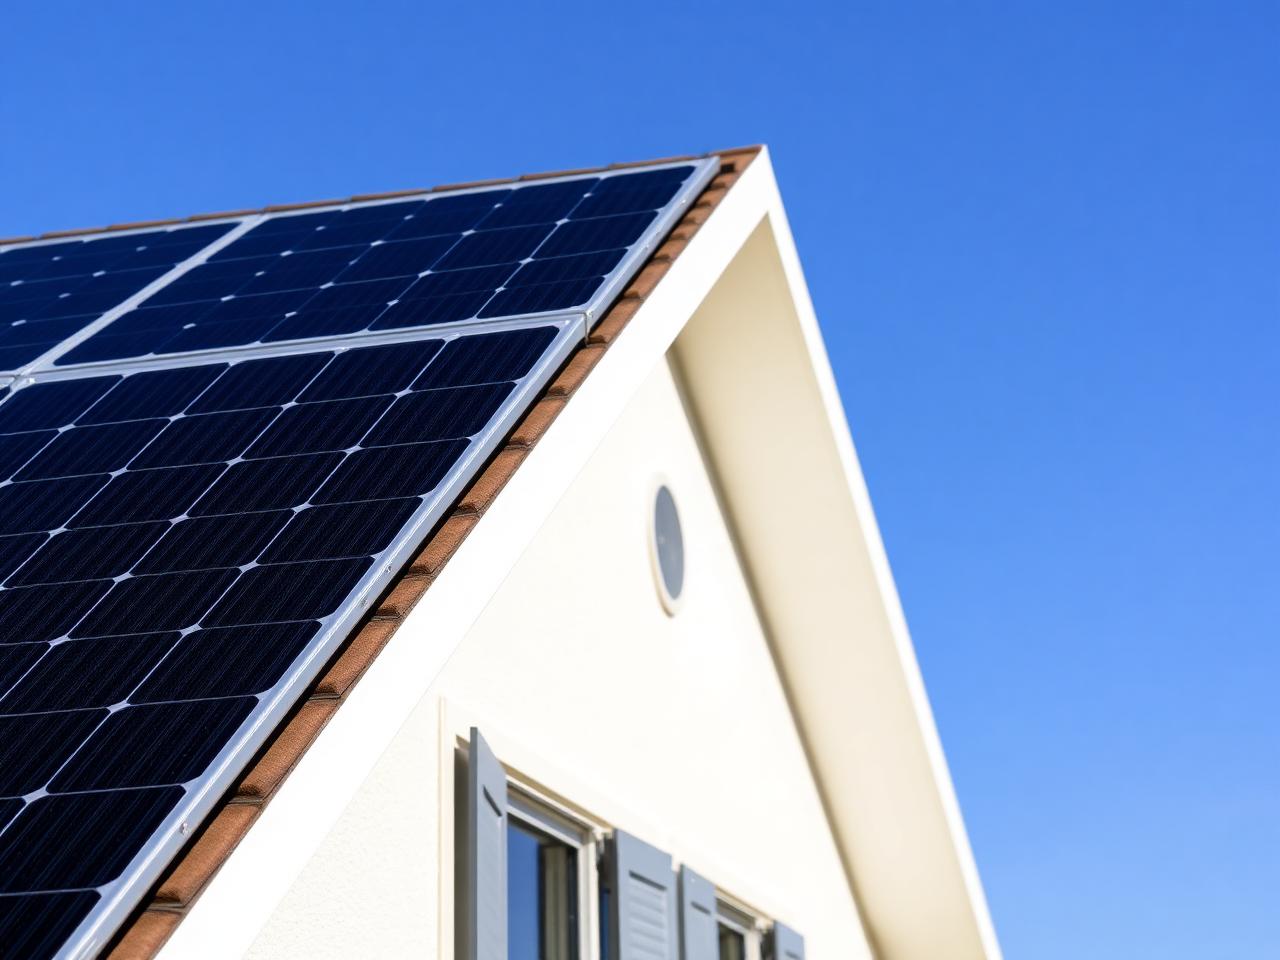
Shading is the most common modelling error. A single chimney or neighbouring tree can cost a string 15–20% of its annual yield unless the system uses optimisers or microinverters. We survey with an irradiance model rather than a satellite guess.
A well-designed 4 kWp system will beat a badly designed 6 kWp system on almost every roof we survey.
What we see in practice
Across recent domestic installs, typical payback lands between seven and eleven years, with battery-paired systems clustering at the shorter end where the household has an EV or a heat pump.
How to sanity-check a quote
- Ask for the assumed self-consumption percentage in writing.
- Check whether the export figure uses a real, currently available tariff.
- Confirm the shading analysis method — a satellite screenshot is not one.
- Look for degradation (typically 0.4–0.5%/yr) in the lifetime figure.
If a quote cannot show you those four things, the payback number in it is decoration. Ours is built from your roof, your usage data and a tariff you can actually sign today.